Extracting Bankfull Widths and Stream Slopes from New England Rivers
Environmental policy, such as land management and regulation related to climate change, hinges on reliable, large-scale scientific data. Data related to the size of rivers is especially important. For example, greenhouse gas exchange between bodies of water and the atmosphere is one important parameter which can be derived from the size of a river. Flood prediction modeling, which is also dependent on large-scale scientific data, will increase in importance as global warming continues to affect the New England Seacoast region, where the land is close to sea level. The steepness of a river is also an important characteristic; for example, it may be used to identify sites that might hinder fish passage. Developing new technologies for large-scale data collection is therefore an important opportunity for environmental scientists.

Daniel Okuniewicz
High-resolution lidar remote sensing is a highly useful emerging technology for large-scale data collection. Lidar, which stands for “light detection and ranging,” is a remote sensing technique that uses bouncing light to detect objects and surfaces. Digital elevation models, which are terrain images whose pixels represent elevations, are often created using lidar remote sensing. Some applications of remote sensing include monitoring shorelines, tracking sediment transport (Villar et. al., 2013), mapping (e.g., Google maps), hazard assessment, land-use monitoring, and estimating river discharge (Bjerklie et. al., 2018). Thus, remote sensing is potentially a highly capable method for rapidly obtaining important information about landscapes.
Remote sensing is not practicable in all situations. In 2019, Martin Šikola et al. found that remote sensing reliability decreases with decreasing scale in diverse landscapes, meaning that it is difficult to accurately measure small and topographically variable areas with coarse-resolution remote sensing methods that provide estimates of ground topography every ten meters (one-third arc second). High-resolution lidar techniques overcome this limitation by providing estimates every one to two meters. In addition, although remote measurements can be made quickly and over a large area using aircraft or satellites, they may not be as reliable as field measurements, so they need to be validated.
As an environmental sciences major at the University of New Hampshire (UNH), with a concentration in hydrology, I was motivated to investigate the collection of large-scale data for rivers partly because I enjoy using computers and performing data analysis, and also by a desire to increase the amount of hydrologic data in the United States as part of an effort to understand and stymie climate change. My research was funded by a Summer Undergraduate Research Fellowship (SURF) and mentored by Dr. Anne Lightbody. The goal of my project was to contribute to the advancement of more accurate remote sensing for rivers and streams. Specifically, I worked on extracting (calculating) bankfull widths, meaning the point to which a river can be filled just before spilling over, and stream slopes, or the steepness of the river. A crucial aspect of my research is that all of the lidar data used was either two-meter or one-meter resolution, much higher than the resolution of remote-sensing techniques that commonly have been used.
The Importance of Bankfull Width and River Slope
The chief purpose of this project was extracting bankfull widths and stream slope measurements for New England rivers using digital elevation models created with high-resolution remote sensing data. Bankfull width and stream slope are common hydraulic geometry characteristics that determine other important aspects of a river, such as erosion patterns, stream power, and flood characteristics (Bizzi, 2016). Hydraulic geometry refers to how river size and shape change as a function of the river’s discharge at a given location. Part of the size and shape of a river network is indicated by its drainage area: the total precipitation catchment area which drains to a given point on a river.
Accurate measurements of characteristics such as bankfull widths and stream slopes are important for several reasons. Bankfull width determines stream surface area, which in turn determines gas exchange rates. Dissolved gases, such as carbon dioxide, regularly volatize, which converts them from being dissolved in the water to being a liberated gas. The more surface area a body of water has, the more gas is exchanged with the atmosphere. Information about gases moving into the atmosphere is important for monitoring sources of climate change and other environmental impacts. Bankfull width also gives greater insight into stream power, which in turn determines erosion patterns. Erosion patterns are of great importance for landowners and developers, towns and municipalities, and state government planners.
The purpose of this research project was to extract bankfull widths and stream slopes for New England rivers and streams using existing high-resolution digital elevation models (DEM) created with remote sensing data, then evaluate the DEM-extracted bankfull width measurements with respect to measurements taken in the field. Stream slopes were not evaluated using field measurements because slopes were calculated based on DEM elevation values that are known to be accurate.
Methods

Figure 1: The locations for river reaches selected for study are indicated on this map. Yellow dots indicate the location of a river segment that was analyzed.
I selected sites in New England (Figure 1) based on several criteria. The sites needed to have existing digital elevation models available for at least the river reach (section) to be studied, so that I could extract bankfull width measurements based on those digital elevation models. The sites also had to have at least one bankfull width field measurement available, so that my remote sensing measurements could be validated. Finally, established hydraulic geometry relationships relating drainage area and bankfull width, created from field studies, needed to exist for the reach. Field study sources generally came from state agencies. I selected three rivers for the study: the Lamprey River (New Hampshire), the Exeter River (New Hampshire), and Clesson Brook (Massachusetts).
To extract bankfull widths and stream slopes from existing digital elevation models, I used ArcGIS (a geographic information systems software package developed by Esri); the River Bathymetry Toolkit (a plugin created for ArcGIS for remote sensing of rivers) (McKean et. al., 2009); and the Python computer programming language. Learning to use ArcGIS and the River Bathymetry Toolkit was a challenge. Dr. Lightbody and Chris Olsen wrote a high-quality set of instructions, which was greatly helpful. I also purchased a geographic information systems (GIS) textbook to read periodically to understand the theory behind GIS software. For practical application, I created a general map of the New England region for visual aid purposes and to practice using ArcGIS. By the end of the two weeks I allotted myself in my original proposal, I was familiar with ArcGIS and well-read on GIS software and its applications.
The first step for computer extraction of bankfull widths was to "detrend" the river digital elevation model, or equalize the elevation from headwater to outlet. The result is a more level flow path, which is useful for determining bankfull width (Figure 2). By filling the river digital elevation model with virtual water, the bankfull elevation could be identified as the elevation that just barely contains the water before it spills into the river's floodplain. The bankfull width was then measured at five-meter intervals with a Python script written by Chris Olsen (2020).
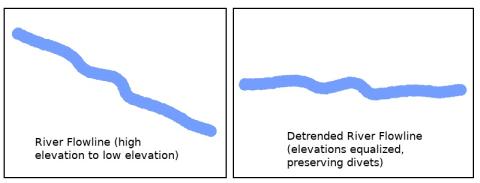
Figure 2: An example of the effect of detrending a river flowline.
Stream slopes were extracted in multiple steps. First, river flowlines from the National Hydrography Dataset (USGS, 2019) were overlaid on top of digital elevation models, then longitudinal elevations (along the length of the stream) were extracted using the same Python script written by Chris Olsen. To calculate slope, I used a linear regression model with a moving window to calculate smoothed slope values at each point along the streams.
For the second part of my research project, I compared my bankfull width findings extracted from remote sensing data with bankfull width measurements from field data. Remotely sensed stream slope calculations were not validated with field measurements, because DEM elevation values are known to be accurate. I originally planned to go to the study sites and take field measurements myself. Due to COVID-19 restrictions, I could not make these field visits. Instead, I had to use field measurements which had been collected already by others. This aspect of the project was challenging because repositories of field bankfull width measurements do not exist. Field measurements are typically part of long fluvial geomorphic assessment reports or environmental hazard studies. When bankfull width data is provided, the locations where cross-sections were measured is often not provided. I was fortunate to have field bankfull width data provided by Dr. Lightbody (2020) for the Lamprey River, collected in 2011, and by Chris Olsen (2020) for the Clesson Brook. I wrote a Python script to automatically perform necessary calculations and generate plots for the comparison. My Python script was combined with the one written by Chris Olsen.
Results
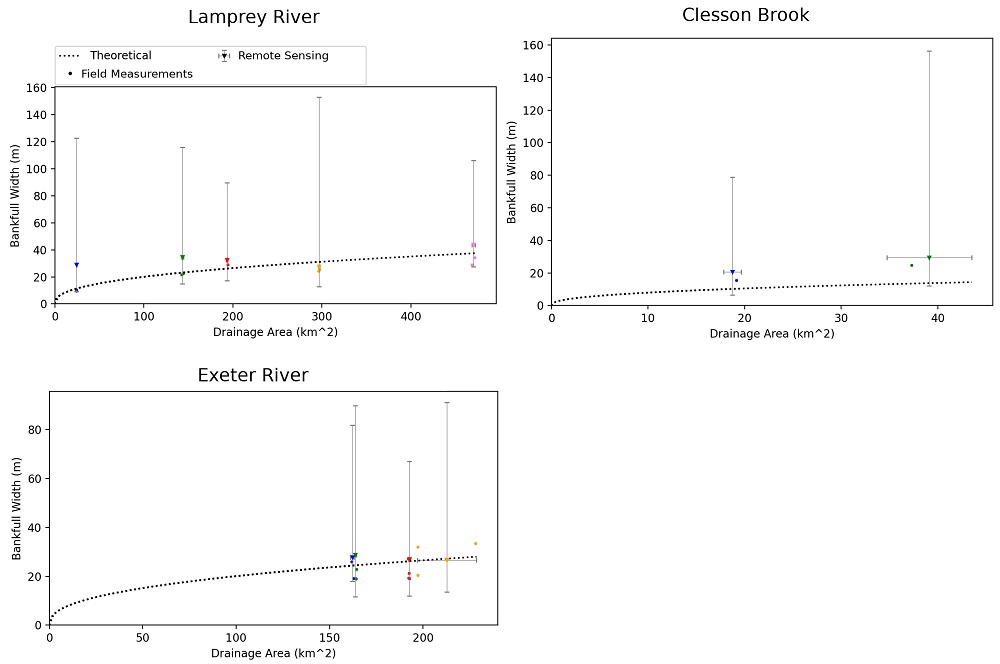
In my research, I observed that the bankfull width, in general, increases as drainage area increases. This is consistent with the established hydraulic geometry relationship between drainage area and bankfull width, characterized by the equation: W = cWSf where W is the bankfull width, WS is the watershed area (drainage area), and c and f are constants which depend on the landscape (Bent & Waite, 2013).

Figure 3: Bankfull width vs drainage area for studied reaches. The error bars represent the range of measurement for remote sensing; vertical error bars are the bankfull width range and the horizontal error bars are the drainage area range (upstream to downstream). The dotted line is the hydraulic geometry relationship. Colors are used to separate river reaches. In general, the remote sensing measurements follow the hydraulic geometry, but the Lamprey River remote sensing strays from it further upstream. Click here to enlarge Figure 3.
Figure 3 shows the results comparing bankfull width and drainage area. I found that the Exeter River and Lamprey River remote sensing measurements of bankfull width do not match the hydraulic geometry relationship as well as the field measurements do. However, both rivers get closer to the hydraulic geometry relationship downstream. It is possible that the smaller drainage areas that one would observe further upstream are simply more difficult to measure; stream sections draining small drainage areas are smaller, therefore there is a higher percentage of error using remote sensing to estimate the width of those sections. Further downstream, the drainage area increases, reducing that possible uncertainty. Clesson Brook deviated further from the hydraulic geometry relationship downstream, but the field measurements show a similar trend.

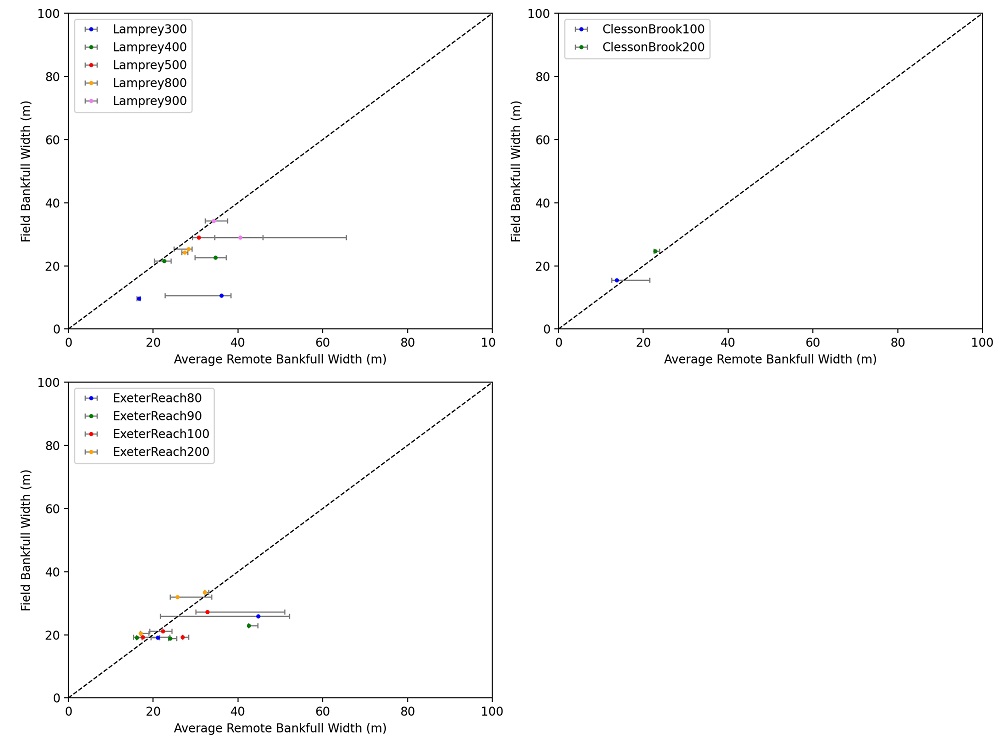
Figure 4: Field measurements of bankfull width for studied reaches compared to nearest five remotely sensed bankfull widths averaged together. Horizontal bars indicate the range from low to high estimates of bankfull width. The dashed line is a 1:1 relationship for comparison. Reaches IDs are indicated by the name of the river followed by a number. Lamprey River remote sensing measurements stray further from field measurements than remote measurements for the Exeter River and Clesson Brook. Click here to enlarge Figure 4.
Figure 4 shows the results comparing the remotely sensed bankfull widths with the field-measured bankfull widths. Data points that fall close to the one-to-one line show that the field measurements and remote sensing measurements are close together. For most of the data points among the Exeter River and Clesson Brook, the error margins overlap the one-to-one line, which shows that the remote sensing measurements are close to the field measurements. For the Lamprey River there are more remote sensing measurements that are not as close to the field measurements. Additionally, the Lamprey River remote sensing measurements have more measurements with higher margins of error than the Exeter River and Clesson Brook have.
The remote sensing measurements of bankfull width do make physical sense. I observed a trend of each river's average slope decreasing as the distance downstream increases. That makes sense, because rivers tend to flow from steep locations to flatter areas as they get further from their headwaters. Additionally, the average drainage area of each reach increases further downstream. That is also expected, because the river is joining with other tributaries, and the river itself is increasing in size.
Overall, the remote measurements of bankfull width follow expected patterns, but they are not on par with field measurements because they deviate further from the theoretical hydraulic geometry. The results of my project suggest that remote sensing of river widths and slopes using high-resolution topography data can be used as an aid to environmental study, but cannot yet replace or fully replicate field measurements, due to the high uncertainty involved. However, remote sensing has the great advantage over field collection by allowing large areas to be studied in a shorter period of time. In its current form, remote sensing could be used to provide baseline justification for investing more time into an environmental project. I am continuing my research by processing more river reaches and comparing the River Bathymetry Toolkit measurements with other GIS tools for remote sensing bankfull widths.
Conclusion
This fellowship experience has taught me new skills and sharpened skills I already had. Expert use of geographic information systems (GIS) software is an essential skill that I acquired while embarking on this research. GIS knowledge and application is becoming increasingly necessary for environmental research and consulting. Although the University of New Hampshire's environmental sciences major requires an introductory GIS course, having real working experience utilizing it in an independent project provides a solid foundation for my future as a hydrologist.
Additionally, while I already had some familiarity with scientific papers, this project greatly increased my scientific literacy. Reading and analyzing other people's research with my mentor forged within me new understanding of the background and implications of my own project. The opportunity to explore independent research with solid mentorship has been a real boon for my progress in environmental science. The best aspect of this experience, to me, was the opportunity to work directly with Dr. Anne Lightbody, to have her knowledge and experience at my disposal, while maintaining a high degree of freedom. I am fortunate that my project had the flexibility to allow me to conduct my research fully remotely. Because of that, I did not lose much value from this experience due to the pandemic.
Remote sensing techniques are constantly improving, and with that so is their usefulness. The remote sensing technique I explored, the River Bathymetry Toolkit, is generally in agreement with established hydraulic geometry for the region I studied. This research constitutes a small contribution towards the advancement of remote sensing techniques by evaluating the efficacy of one of the many tools that have been developed. In the future, remote sensing will likely have the capability to provide large-scale data for scientists everywhere. We will be able to improve flood prediction models and greenhouse gas exchange estimates, as well as create detailed plans for erosion mitigation and dam removal projects.
I would like to thank Dr. Anne Lightbody for her mentorship and support, and for giving me the opportunity to work on this project. I would also like to thank MS candidate Chris Olsen for his past work, his support, and for providing me with resources. I am grateful for my opportunity to explore this quickly growing field, and for the knowledge and resources provided to me by the SURF program, whose funding made this possible. My sponsor, Mr. Dana Hamel, whose financial contributions made this research possible, also receives my gratitude. Finally, I want to thank my girlfriend, Taylor Dickinson, who motivates me daily.
References
Bent, Gardner C., and Andrew M. Waite. 2013. “Equations for estimating bankfull channel geometry and discharge for streams in Massachusetts.” USGS Scientific Investigations Report 2013–5155.
Bizzi, Simone, Luca Demarchi, Robert C. Grabowski, Christof Weissteiner, and Wouter van de Bund. 2016. “The use of remote sensing to characterize hydromorphological properties of European rivers.” Aquatic Sciences 78:57–70.
Bjerklie, David M., Charon M. Birkett, John W. Jones, Claudia Carabajal, Jennifer A. Rover, John W. Fulton, and Pierre-André Garambois. 2018. “Satellite remote sensing estimation of river discharge: Application to the Yukon River Alaska.” Journal of Hydrology 561:1000–1018.
Lightbody, Anne. 2020. Personal Communication.
McKean, Jim A., Dave Nagel, Daniele Tonina, Philip Bailey, Charles Wayne Wright, Carolyn Bohn, and Amar Nayegandhi. 2009. “Remote sensing of channels and riparian zones with a narrow-beam aquatic-terrestrial LIDAR.” Remote Sensing 1(4):1065–1096.
Olsen, Christian. 2020. Personal Communication.
Šikola, Martin, Petr Chajma, Petr Anděl, Milič Solský and Jiří Vojar. 2019. “Finding water: Reliability of remote-sensing methods in searching for water bodies within diverse landscapes.” Ecohydrology & Hydrobiology 19(3):383–392.
USGS. 2019. “National Hydrography Dataset.” United States Geological Survey, National Geospatial Program.
Villar, Raúl Espinoza, Jean-Michel Martinez, Marie Le Texier, Jean-Loup Guyot, Pascal Fraizy, Paulo Roberto Meneses, and Eurides de Oliveira. 2013. “A study of sediment transport in the Madeira River, Brazil, using MODIS remote-sensing images.” Journal of South American Earth Sciences 44:45 – 54.
Author and Mentor Bios
Daniel J. Okuniewicz Jr., from Portsmouth, New Hampshire, is an environmental sciences major, with a concentration in hydrology, at the University of New Hampshire (UNH). In 2020, he was awarded a Summer Undergraduate Research Fellowship (SURF) from the Hamel Center for Undergraduate Research. He was eager to work with Dr. Anne Lightbody, an associate professor in the Earth sciences department at UNH, and they developed his SURF research to align with what Daniel thought was her most interesting project. Daniel says that the most challenging aspect of his research was learning a lot about using geographic information systems (GIS) in a short amount of time, but this was also one of the most rewarding aspects. The COVID-19 pandemic also brought up some challenges. Originally, he planned to conduct his own fieldwork, but due to pandemic restrictions he had to find existing data for his study sites. With his research successfully completed, he decided to publish with Inquiry to share his work with others, and as a way to make a permanent record of his undergraduate research experience. Daniel will graduate in May 2021 with a bachelor of science degree. He will then work in the environmental/hydrology industry for a time before moving on to graduate school.
Anne Lightbody is an associate professor in the Department of Earth Sciences at the University of New Hampshire (UNH), where she has worked since 2010. Dr. Lightbody specializes in surface-water hydrology and has mentored many undergraduate researchers in the field, including Inquiry 2019 author Hannah Miller. She explains that her work mentoring Daniel in 2020 for his Summer Undergraduate Research Fellowship grew out of a collaboration with colleagues across New England using high-resolution topography data to understand river networks in ways that were impossible just a decade ago. Dr. Lightbody praises UNH undergraduate researchers like Daniel as being, “curious, competent, and enthusiastic, and it is an absolute pleasure to get to work with them.” The COVID-19 pandemic of 2020 made for some novel moments in the mentor/mentee relationship, such as conducting a pandemic-protocol-compliant computer handoff to Daniel at an empty parking area in A-lot, complete with disinfectant, sterile gloves, and face masks. “Subsequent meetings on Zoom seemed cozy by comparison,” says Dr. Lightbody. She is pleased with the results of Daniel’s research, including the skills he has practiced by writing his article for Inquiry: “It is important to be able to explain the purpose, motivation, and findings of your work for the general public, who often fund and hopefully benefit from the hard work of scientists.”
Copyright 2021, Daniel J. Okuniewicz Jr.