Analyzing Quality of Care in New Hampshire Nursing Homes in Relation to Ownership Status
During the summer of 2023, I participated in the Summer Undergraduate Research Fellowship (SURF) program through the Hamel Center for Undergraduate Research at the University of New Hampshire. Conducting undergraduate research through the Hamel Center provided me with the unique opportunity to advance my understanding of data analytics beyond what had been introduced in my courses. As an analytical-economics major with a minor in statistics, I had a baseline understanding of data analysis and its applications through introduction to open-source programming languages such as Python, RStudio, and statistical software JMP. My coursework allowed me to demonstrate that I have the practical skills and potential to learn varying coding and computational platforms in preparation for a career as a data analyst. However, conducting undergraduate research allowed me to leverage a real-world application of data analytics while enabling my exploration of an industry I am interested in.
Following my completion of the course Health Economics (ECON620) I was inspired to continue exploring how my love for economics may be employed to help others. Having volunteered in nursing homes throughout my twelve years as a Girl Scout, I hoped to pay tribute to all the wonderful friends I made during that time by using healthcare analytics to find ways to improve quality of care for the approximately 5,807 New Hampshire residents in skilled nursing facilities. My research investigated the seventy-three skilled nursing facilities in New Hampshire to identify whether a relationship exists between ownership type and quality of care.
Residents of skilled nursing facilities are a uniquely vulnerable population whose overall health status is expected to decline somewhat, since often, deteriorating health measures are what cause them to move into these facilities. Because of this anticipated decline in health status, researchers must work carefully to accurately identify accepted quality of care measures, referring to state and federal guidelines frequently. The goal of my research was to investigate whether a relationship exists between economic indicators and quality of care, with the intent to contextualize and visualize the current state of this industry in New Hampshire. Identifying economic indicators such as ownership type, staffing indicators, and rurality indicators provides the researcher with the ability to better identify where policy is needed to improve skilled nursing facility quality of care.
Understanding Data
Nursing homes have varying types of ownership: for-profit, nonprofit, or government owned. I was unable to visit all of New Hampshire’s seventy-three skilled nursing facilities to investigate each one’s level of care, and thus I relied on publicly available quality of care indicators. Publicly available quality of care measures allow prospective residents and those related to current residents to monitor the average level of care provided in an individual skilled nursing facility. In addition to this, quality of care indicators allow researchers to quantify and statistically describe the variance in care within individual skilled nursing facilities. These indicators include variables such as rehospitalization percentages, mobility improvement, percentage of outpatient hospital emergencies, and more.
To collect this data, I downloaded varying datasets from CMS.gov, including provider information, skilled nursing facility quality reporting program national data, skilled nursing facility minimum dataset quality measures, penalties, state-level health inspection data, fire safety deficiencies, Medicare claims quality measures, health deficiency data, health inspection dates, and ownership. Using RStudio, I combined these datasets, using their shared variable of CMS certification number to create one large dataset encompassing national data. Then I filtered this dataset to include only nursing homes within New Hampshire, to keep the study’s scope manageable to best accommodate the project’s ten-week span. From this point, I was able to focus on each of the seventy-three skilled nursing facilities in the state. I added a rurality indicator to each skilled nursing facility, with a 1 indicating location in a rural area and a 0 indicating the opposite, to allow for better visualization of the barriers New Hampshire residents face when deciding upon a skilled nursing facility. It was important to include these rurality indicators to investigate whether additional barriers for quality care exist for New Hampshire state residents because of geographic location. This also allowed me to investigate the dispersion of for-profit and nonprofit skilled nursing facilities based on geographic location.
The opportunity to create my own dataset provided me the chance to better understand the steps taken to conduct an effective research study. I was faced with the task of cleaning and processing the dataset I created for this study. Although this had been alluded to in my courses, I had not yet been tasked with conducting the cleaning process myself. Cleaning a dataset means reformatting data to successfully load and manipulate it within a coding platform through fixing incorrectly inputted or formatted values, ensuring there is no duplication of variables, and restructuring how variables were inputted. An instance of variable reformatting meant changing how measurements of time were recorded or changing the format from hours and minutes to aggregated minutes. I replaced missing values with means, and had to correct typos as well as reformat data types to best display the data (such as denoting variables as geographic indicators to map the variables). During the cleaning/processing portion of this project, I filtered out facilities that served only short-term rehabilitation patients to focus on the specific population of long-stay residents at a skilled nursing facility. The opportunity to clean and process my own dataset grew my understanding of data analytics, requiring me to acquaint myself with the meticulous requirements for effective data analysis.
Data Analysis
Following data collection and cleaning, I began univariate analysis—the analysis of singular variables on their own—such as quality rating, mobility improvement, rehospitalization rate, number of falls resulting in hospitalization, and other indicators of quality of care.
When analyzing quality of care in this population, I compared the quality measures of the seventy-three skilled nursing facilities in New Hampshire to the national and state averages to account for expected levels of declining health measures. Focusing on variance of quality of care from national and state averages allowed me to better understand how each individual skilled nursing facility performed, accounting for anticipated health decline, to identify the level of care being provided. Thus, quality of care in this study was calculated using a combination of these deviations from the expected averages for long-stay patients only, omitting data collected from patients staying for short-term rehabilitation.
I was able to investigate the properties of each of the collected variables, calculating descriptive statistics for each of the variables used in data analysis. Descriptive statistics such as mean, median, and mode allowed me to investigate the central tendency of each variable, indicating the calculated middle of each variable’s distribution. Calculating the standard deviation, interquartile range, and range allowed me to understand the spread of the variables and identify potential outliers.
Calculating these descriptive statistics allowed me to confirm the conditions to analyze the distributions of the variables. Conditions for such an analysis include a sample size of greater than thirty, a normal distribution, independence of variables, and no outliers being present. A normal distribution is one where the variables are clustered around the mean, and the distribution tapers off on both sides at a similar rate.
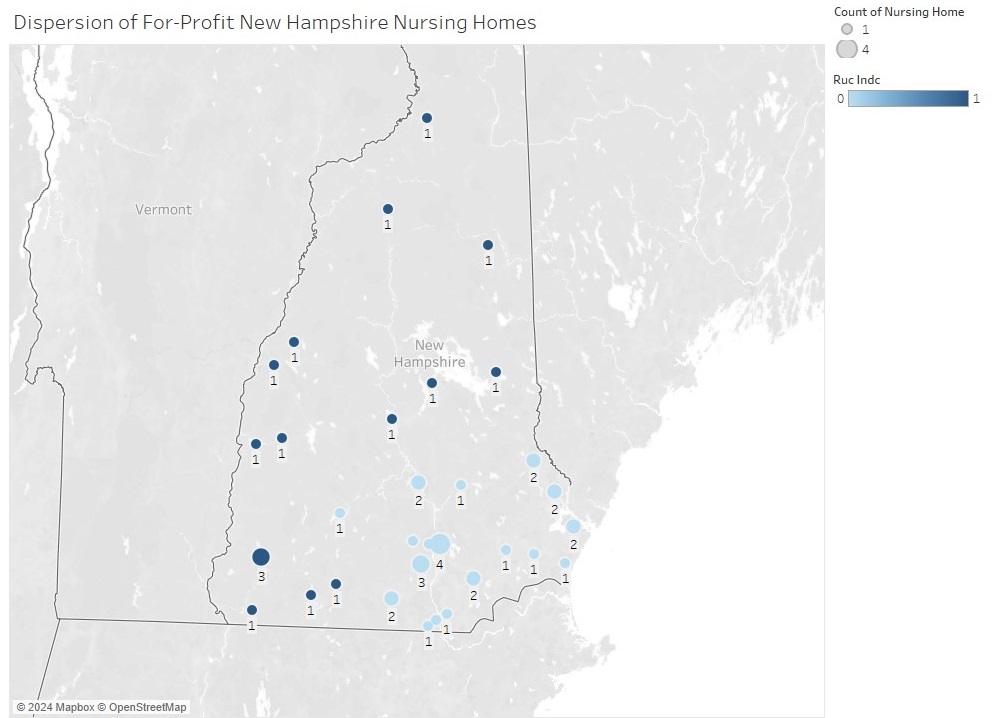
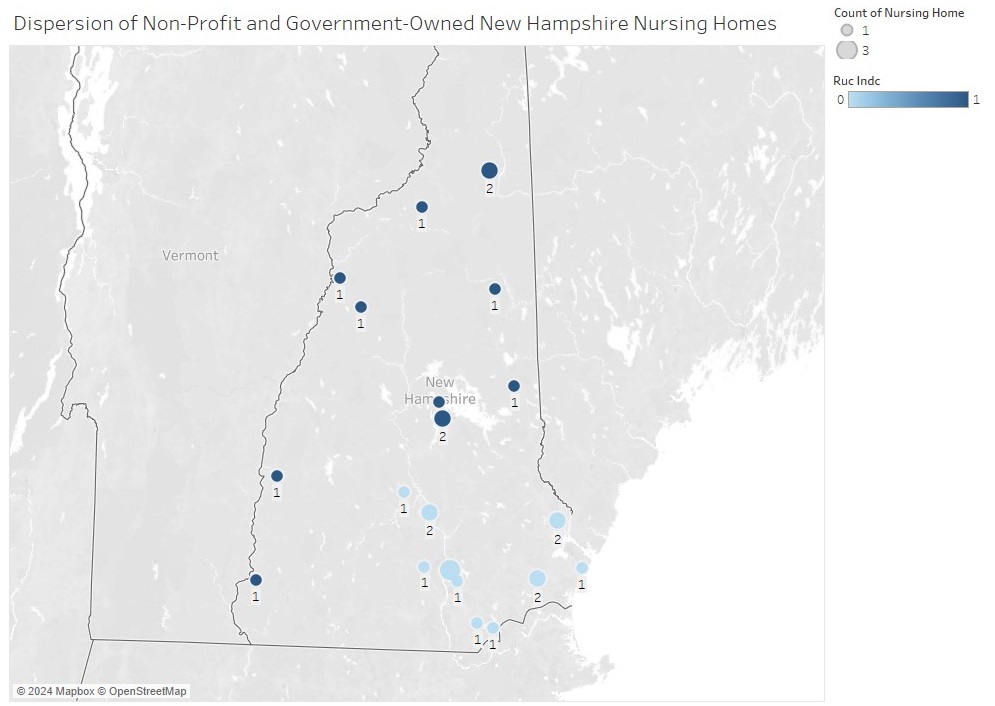
Once these variables were checked, I was able to use Tableau, a data visualization tool, to create models showcasing the dispersion of variables. I filtered data by varying conditions such as facility ownership, rurality, and various quality measures, creating charts and graphs to represent the state of New Hampshire’s nursing home market. Specific maps were created to showcase the dispersal of nonprofit versus for-profit skilled nursing facilities, using the rurality indicator to understand how a New Hampshire resident’s city may impact access to skilled nursing facilities with different ownership models. I created maps showcasing the dispersal of all nursing homes, for-profit nursing homes, and non-profit/government owned facilities with indicators for nursing homes located in rural cities. (See Figure 1, Figure 2, and Figure 3.)
In addition to these maps, I calculated the distribution of various quality of care measures such as rehospitalization percentages, changes in mobility, and percentage of residents on anti-depressants/ anti-psychotic medications. Included in this paper are distributions for overall quality of care, as measured by the Center for Medicare and Medicaid Services on a scale from 1-5, filtered by ownership status. It is noted that the average quality rating of for-profit nursing homes is higher than non-profit/government owned, however the non-profit/government owned nursing facilities have an outlier (Glencliff Home for the Elderly with a Quality Rating of 1) and a smaller standard deviation indicating a smaller spread of the distribution. Glencliff Home for the Elderly is a government owned nursing facility, raising the question of whether non-profit nursing facilities have significantly different quality rating’s than for-profit nursing facilities when government owner facilities are excluded.
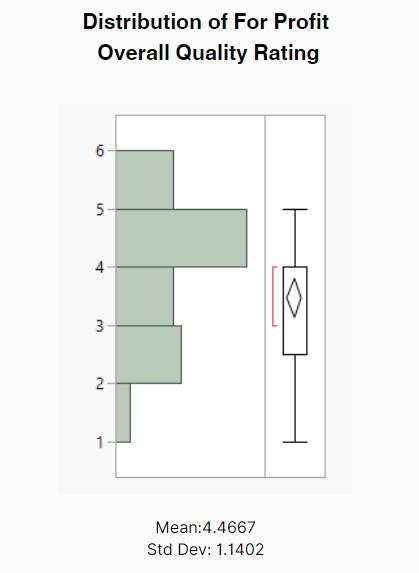
Figure 4: Histogram and boxplot displaying the distribution of overall quality rating for for-profit nursing homes in the state of New Hampshire. Centered at 4.4667 with a standard deviation of 1.1402. The quality ratings range from 1 (poor quality) to 5 (high quality).
Results and Discussion
My research revealed that New Hampshire has 45 for-profit skilled nursing facilities, 16 nonprofit skilled nursing facilities, and 12 government-owned skilled nursing facilities. When investigating the 28 nonprofit and government-owned skilled nursing facilities within the state, my faculty mentor Dr. Esmaeil Bahalkeh and I found an average quality rating of 3.346, with a standard deviation of 1.03 for the nonprofit/government-owned nursing homes. With 95% confidence level we determined the true mean quality of care value falls between 2.96176 and 3.730778.
These quality ratings are measured out of 5, and account for short-term and long-term quality of care indicators. This indicator is of utmost importance to those shopping for skilled nursing facilities, because it aggregates measures of positive and negative indicators such as emergency visits to the hospital, mobility improvement, number of falls, and hours per registered nurse per resident per day.
The distribution of the nonprofit/government-owned nursing homes appears approximately normal. However, the two-outlier low quality of care skilled nursing facilities skews the distribution slightly left. The 45 for-profit nursing facilities have an average quality rating of 3.477, with a standard deviation of 1.151. With 95% confidence level we determined the true mean quality rating falls between 3.127 and 3.827.
The distribution of quality ratings for for-profit nursing facilities is relatively normal with a right skew. Because the 95% confidence interval for quality rating of nonprofit/government-owned nursing facilities overlaps with the for-profit nursing facilities’ 95% confidence interval, we are unable to conclude that there is a significant difference in mean quality of care between ownership types.
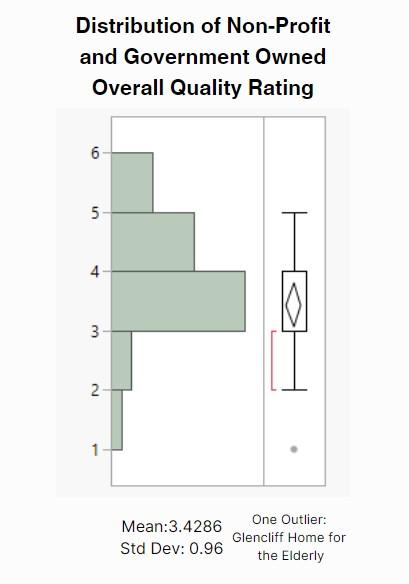
Figure 5: Histogram and boxplot displaying the distribution of overall quality rating for non-profit and government-owned nursing homes in the state of New Hampshire. Centered at 3.4286 with a standard deviation of 0.96. The quality ratings range from 1 (poor quality) to 5 (high quality). Note that there exists one outlier (government-owned Glencliff Home for the Elderly) with a quality rating of 1 out of 5.
When comparing the quality ratings for nonprofit nursing homes in New Hampshire with state averages, we see that nonprofit and government-owned facilities average a slightly lower quality rating. However, the for-profit nursing facilities average a slightly higher quality rating. This evidence leads us toward the conclusion that the original hypothesis that for-profit nursing facilities have a worse average quality of care is likely false. Drawing definite conclusions about the true state of quality of care by ownership status requires further research. Steps such as removing outliers, focusing on long-term quality of care ratings, and investigating staffing ratings will provide further evidence to determine if ownership significantly impacts quality of care.
With both for-profit and nonprofit facilities having an average quality rating above a 3, we infer that New Hampshire has relatively high quality care within skilled nursing facilities. However. there is room for future research through comparing New Hampshire nursing facilities with those in nearby states such as Maine, Vermont, and Massachusetts, since these states are geographic alternatives for New Hampshire residents.
Of the 45 for-profit owned nursing facilities in New Hampshire, 21 were owned by Genesis Healthcare, which represents 46.67% of the for-profit skilled nursing facilities in the state. To determine if there is a significant difference between the quality of care at for-profit nursing facilities owned by Genesis Healthcare and the 24 other for-profit-owned nursing facilities, the distributions would need to qualify a few conditions. However, this research project’s sample size of for-profit nursing facilities was not adequate to make the comparison. To investigate whether Genesis Healthcare owning a nursing facility has a significant difference on quality of care, a new investigation would need to be run, and I recommend a difference-in-difference investigation, comparing quality of care indicators for nursing facilities before and after they are purchased by Genesis Healthcare. At this time, we accept that Genesis Healthcare owns a significant proportion of for-profit-owned nursing facilities. However, with only 21 facilities being owned by Genesis, and 24 being owned by general for-profit ownership, and neither of these samples greater than the required 30, we cannot properly investigate differences in quality of care.
From SURF to Internship
Following my completion of SURF, I began to search for an internship for the summer of 2024. While connecting with employers at one of UNH’s Career and Professional Success Career Fairs, I saw firsthand the impact SURF had on my ability to network with employers. Not only was I able to showcase that I had an introduction to data analysis, but my research experience acted as a point of connection for certain industries. While completing SURF allowed me to demonstrate my technical data analytics skills, I was also able to speak to recruiters from nursing homes, health insurance companies, and hospitals by leveraging my introduction to healthcare analytics. With a more general data analytics background provided through my coursework, the unique opportunity of analyzing an area of my professional interest helped me differentiate myself from other hopeful data analysts.
In fall 2023 I applied for the Analyst Development Program with Liberty Mutual Insurance. During the interview process, I was able to reference my SURF project in discussing my firsthand experience with data analysis, and the project also provided a testament to my work ethic. The final interview lasted three hours. It consisted of a thirty-minute overview, a one-hour behavioral interview, a one-hour case study, and a thirty-minute job shadow. During the behavioral interview my SURF experience demonstrated my ability to work in an online/hybrid manner, my time management skills, and my passion for data analysis. I proved to the interviewers I could independently bridge my own knowledge gaps, in addition to learning from a mentor, which is an aspect of the Analyst Development Program. I received the internship and am looking forward to working via a hybrid arrangement in their Boston office in summer 024.
While being an analytical-economics major pursuing a minor in statistics, my coursework has provided me with the tools to enter the workforce as a successful data analyst. However, it is my completion of undergraduate research experiences such as the Summer Undergraduate Research Fellowship that proves to recruiters that I am not only capable of doing the job, but I am the best candidate for it. Participating in such a high-impact experience has taken my understanding of data analytics from a classroom level to one that can and has been employed in real-world scenarios. The opportunity to work closely with real-world data relating to my greater community provided me the firsthand chance to understand the complexities of working with real-world data, and the complications relating to healthcare analytics in particular.
I would first like to extend a thank-you to my wonderful mentor Dr. Esmaeil Bahalkeh, whose patience in guiding me through understanding healthcare analytics was an invaluable asset in my completion of my Summer Undergraduate Research Fellowship (SURF). To Mr. Dana Hamel and the Patricia M. Flowers ’45 Scholarship Fund— thank you for providing financial support for my SURF grant. To the incredible staff at the Hamel Center for Undergraduate Research with whom I have had the pleasure to work these past three years, Dr. Paul Tsang, Dr. Molly Doyle, and Amanda Leger, thank you for not only the opportunities to expand my journey with research but the compassion and patience you have shown me throughout this process. Thank you to my former faculty mentor for the Hamel Center’s Research Experience and Apprenticeship Program, Professor Reagan Baughman, for introducing me to and cultivating my love for health economics. I am incredibly grateful for the opportunities I have been lucky enough to pursue within undergraduate research, and the deeper love for inquisition and learning that has resulted from these experiences. I want to conclude my acknowledgments with a thank-you to my parents for their continued support as I explore the realm of research.
Author and Mentor Bios

Originally from Chagrin Falls, Ohio, Mary “MJ” Condon will graduate in May 2025 with a bachelor of science degree in analytical economics, with a minor in statistics. She is a Paul Scholar, and member of Omicron Delta Epsilon the International Honors’ Society at the University of New Hampshire. A course in health economics inspired MJ to pursue this research project that would expand her understanding of Health Analytics, while also impacting the greater community in the state of New Hampshire. Her Summer Undergraduate Research Fellowship allowed her to gain firsthand experience in the intricacies of analyzing real data, from collecting and processing my own data for the first time, to diving into the complexities that arise when investigating healthcare data. MJ enjoyed the creativity of crafting her own study and submitted to Inquiry to showcase to other curious students that undergraduate research is for every student regardless of discipline. She says that “the opportunity to discover something new about a topic and the ability to change systems through research has helped me better understand my own college major and possible careers.” MJ hopes to pursue graduate school, continuing in her field of economics.
Esmaeil Bahalkeh is an assistant professor in the health management and policy department. He started teaching at the University of New Hampshire in 2021 and specializes in healthcare operations management, health analytics, healthcare processes, and quality improvement. Because of their mutual research interest in healthcare analytics and long-term care, MJ and Dr. Bahalkeh decided to investigate variations in nursing home quality metrics across the state of New Hampshire. He found it interesting to discover that nursing homes in New Hampshire vary widely in terms of quality metrics and features. He describes collecting nursing home data from different sources as one of the challenging parts of the project that MJ completed successfully. On working with MJ, Dr. Bahalkeh says, “It was a fun and rewarding experience” and that he looks forward to similar mentorship opportunities in the future.
Copyright 2023 © MJ Codon