Contributing to the Field of Dam Removal Science: Analyzing Sediment Characteristics in Mill Pond and Sawyer Mill
Research, whether formal or informal, is woven into the intricacies of everyday life. In its rawest form, it is the pursuit of truth; research seeks to provide a better understanding of the world we live in. Entering the University of New Hampshire (UNH) campus as a civil engineering student, I didn’t anticipate the vital role research would come to play in my academic experience or in my understanding of how engineering principles are developed. The understanding that pressure increases with increasing depth through a water column, that silts and clays have a lower allowable bearing capacity than gravels or sands, or that concrete performs poorly when loaded in tension were not always established facts used by professionals. This knowledge was discovered and developed through research.
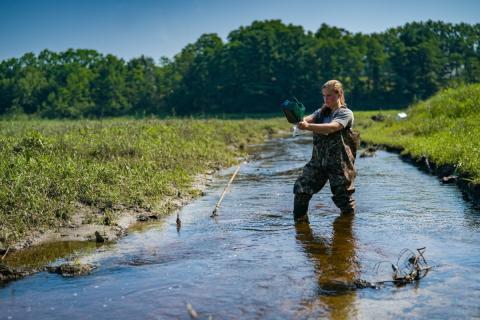
The author collecting sediment samples at Sawyer Mill impoundment in Dover, New Hampshire. Photo credit: Jeremy Gasowski.
I was introduced to my research mentor, Dr. Anne Lightbody, through UNH’s Innovation Scholars Program. During one of our meetings, Dr. Lightbody mentioned an opportunity to conduct geochemical research over the summer. After drafting an eight-page research proposal with an outline of projected costs and scrambling for last-minute letters of recommendation, I found myself accepting a fellowship through the Research Experience and Apprenticeship Program (REAP) for the summer of 2019. I researched relationships between sediment grain size, mercury content, and spatial distribution of sediment impounded, or accumulated upstream of, two dams near the University of New Hampshire: Sawyer Mill Dam in Dover and Mill Pond Dam in Durham. Each dam was either being considered for, or was in the process of, removal, making my research relevant for the local communities. The research project’s overall goal was to improve the tools and knowledge available to river corridor managers and community members assessing dam removal feasibility.
The Dam Dilemma
The United States is home to more than 90,000 dams (ASCE, 2017). Historically, these dams have been used for navigation, irrigation, flood control, and hydropower (Bellmore et al., 2017). However, the average age of dams in the United States is greater than fifty years (ASCE, 2017). In 2016, approximately 15,500 of these aging dams were identified as high-potential hazards, characterized by expected loss of life and substantial economic damage upon failure (ASCE, 2017). For dams that are no longer economically viable, removal is becoming an increasingly common method to remove infrastructure risk and restore ecological function to rivers (Bellmore et al., 2017).
Every dam removal should include an analysis of the quantity and quality of sediment settled in the developed reservoir behind the dam—known as the dam’s impoundment—because this sediment could mobilize downstream after the dam’s removal (Evans, 2015). Dam removals involving contaminated impounded sediment require environmental remediation, a process in which engineers and scientists attempt to eliminate or reduce contaminants such as heavy metals (e.g., mercury), organochlorines (e.g., pesticides), and polynuclear aromatic hydrocarbons (e.g., chemicals found in coal, oil, and gasoline). Remediation is an expensive and complicated process (Major and Warner, 2008; Edwardson et al., 2016). The financial cost of dam removal varies from site to site; a case study published in 2016 found that the estimated cost of dam removal varied from $325,000 to $324,700,000 (Lawson, 2016). Insights into the quantity and quality of impounded sediment before removal are valuable to determine the volume of sediment that requires excavation, dredging, capping, or stabilization and to determine the subsequent costs of removal and remediation (Edwardson et al., 2016). However, dam removal research is severely lacking; scientists have studied the resulting water quality and hydrologic, geomorphic, and biological responses in fewer than 10% of the dams removed in the United States (Bellmore et al., 2017).
Research as a Solution
To predict the environmental and economic implications of a dam’s removal, researchers need to collect data on the quantity and degree of contamination within impounded and mobile sediment. This data is typically collected by thoroughly surveying the site, collecting water velocity measurements, and sampling sediments at as many locations as possible throughout the impoundment, because factors such as metals contamination, sediment grain size, and sediment depth vary from location to location. However, testing a large number of samples is prohibitively expensive. Instead, limited time and resources are used to collect a finite number of samples at carefully selected locations with the goal of representing the entire impoundment.
Focusing My Research
Based on a desire to contribute to the developing field of dam removal science, I characterized the bulk density, grain size, organic matter fraction, and mercury content of sediment impounded at Sawyer Mill Dam on the Bellamy River and at Mill Pond. Combined with information about sediment depth and impoundment area, the bulk density of the sediment can be used to estimate the quantity of impounded sediment. Determining the dominant sediment grain size of an impoundment is crucial, as finer-grained sediment is more mobile and has been associated with elevated metals content. The organic matter fraction of sediment describes the amount of decaying plant and animal tissue within sediment and is therefore an indication of the organic carbon content (Government of British Columbia, 2014). The organic carbon content of sediment affects the adsorption of organic compounds to sediment (Total Organic Carbon, 2014). Mercury is a government-regulated metal, and any high concentrations found in sediment are concerning when considering a dam removal.
To prepare for my research, I spent the last two weeks of May reviewing studies previously conducted in 2009 and 2018 at Durham’s Mill Pond and in 2014 and 2016 at Dover’s Bellamy River. I also reviewed various methods and procedures used for conducting dam removal analyses. With the input of UNH faculty Anne Lightbody and Julie Bryce, research scientists Florencia Fahnestock and Scott Greenwood, and graduate students Eliza Balch and Alexandra Evans, I developed sampling strategy maps for each site. At each impoundment, I focused my samples along three transects (lines of interest) across each water body perpendicular to flow: (1) near each impoundment’s inlet, (2) mid-impoundment, and (3) downstream closer to the dam. I then selected sampling locations along the three transects in spots not previously sampled in order to complement preexisting data.
From Waders to Lab Coat
I used two different sampling methods. To characterize more readily mobile sediment, I collected three to four surficial samples per transect at each site using a clamshell Van Veen grab sampler. I dropped this grab sampler off the side of the flat-bottomed boat I used for sampling. Upon contacting the sediment surface, the spring-release mechanism triggered the contraption’s jaws to close. I then reeled the sampler out of the water, transferred the sediment to gallon-sized plastic bags, and stored the samples in coolers until I brought them to the lab to be oven dried.
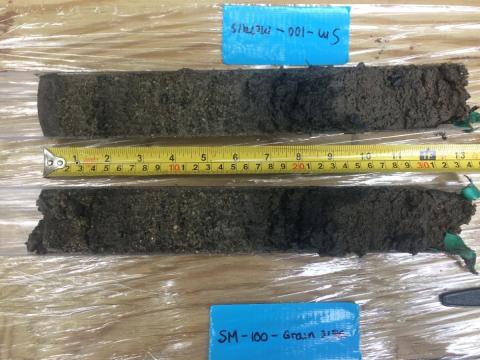
Sediment core collected at Sawyer Mill impoundment using a gravity corer.
To characterize deeper, less mobile sediment I collected two core samples at each impoundment, one along the upstream transect and one along the downstream transect. I used a gravity corer, which is a hollow metal rod 1 to 2 meters long with a 2-inch-diameter plastic extension that is pounded into the sediment as deeply as possible (10 to 70 centimeters). After pulling the core out of the ground and into the boat and returning to shore, I drained water out of the core and split the core in half along its length using nongalvanized metal wire. I then sliced one core half at approximately every 5 centimeters, or at visually distinct sediment strata, to collect grain-size samples. I used acid-washed scoops in mirrored locations along the other half of the core to collect samples for mercury analysis. I placed all the core samples in labeled plastic bags and stored them in a cooler to bring to the lab, where mercury analysis samples were freeze dried and the remaining core samples were oven dried.
After I completed my field sampling, my focus shifted to lab work. I analyzed twenty-three surficial samples for organic matter and grain-size distribution. To determine organic matter fraction I weighed approximately 2 to 5 grams of sample into dry porcelain crucibles, and then heated these crucibles to 550°C. I then re-weighed the sample and assumed that the difference in weight was caused by combusted organic matter.
Grain-size distribution was determined by sieving approximately 200 grams of each dried sample onto a shaker table through a series of standard sieves, where the fraction of mass retained on each size sieve indicated the fraction of sediment within each size class.
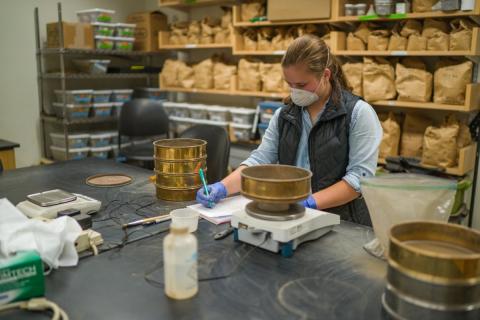
The author conducting sieve analysis on sediment samples. Photo credit: Jeremy Gasowski.
For all four cores, I analyzed the organic matter fraction and grain-size distribution following the same procedures as for the surficial samples. I also analyzed the four cores for bulk density and mercury content. To determine the bulk density, I weighed a known volume of sediment, dried it in an oven for twenty-four hours at 105°C to let the water evaporate, cooled it to room temperature, and then weighed it again, calculating bulk density as the ratio of dry sediment mass to volume. Finally, to determine the mercury content over depth in the sediment cores, approximately 0.05 grams of sediment collected with the acid-washed scoops were analyzed on the Milestone DMA-80 Direct Mercury Analyzer in James Hall.
From Lab Coat to Computer
After spending a week in the field collecting four cores and twenty-three grab samples, six weeks in various labs analyzing these samples, and one week generating more than twenty Excel graphs and twenty ArcGIS maps from more than 100 Excel sheets of data, I began to reflect on the story the data told about each impoundment. I determined that Mill Pond sediment consisted of fine-grained sands throughout the impoundment, with little spatial variability. Sawyer Mill sediment contained much greater variability in grain size, with coarser pea-sized gravel in main channel areas and fine-grained silts and clays in depositional areas. Characterizing the sediment grain size provides us with valuable information: fine-grained sediments tend to be of primary concern in dam removals because these particles have been associated with elevated heavy metal content compared with coarser sediments. Moreover, they mobilize more easily, transporting potential contaminants downstream. Therefore, for both impoundments, sediment management techniques may need to be applied to avoid the mobilization of large volumes of fine-grained sediment.
The organic matter fraction in surficial sediment at Mill Pond varied from 9 to 31%, with an average content of 17%. The organic matter fraction at Sawyer Mill ranged from 1 to 23%, with an average content of 14%. These varying organic matter fractions throughout each impoundment may indicate spatially varying sources of carbon or different sedimentation rates throughout each impoundment. The elevated organic matter content observed in sediments at Mill Pond may contribute to the sediment’s ability to adsorb contaminants such as mercury.
Sediment cores from Sawyer Mill contained relatively low mercury content. The peak value from the Sawyer Mill cores was 105 parts per billion (ppb) by mass, lower than the NOAA 1999 Lowest Effect Level (LEL) of 200 ppb, which describes the lowest tolerable mercury concentration for most benthic organisms in fresh water (Buchman, M. F., 2008; NOAA, FAQs).
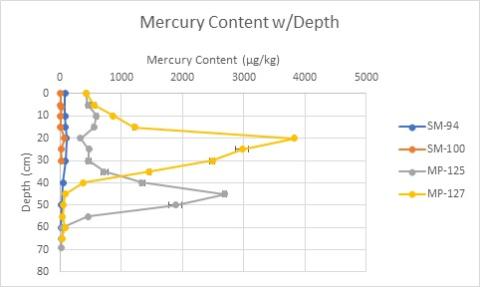
Figure 1: Mercury content over depth in core sediment samples. "SM" denotes cores are from Sawyer Mill; "MP" denotes cores are from Mill Pond.
However, the mercury content analyzed in the Mill Pond cores yielded unexpectedly high values (see Figure 1). Elevated mercury content levels were observed at depths greater than fifteen centimeters at Mill Pond, with a peak value of 3,800 parts per billion. Several sediment samples from the Mill Pond cores contained mercury levels not only above the NOAA LEL but also above the NOAA 1999 Severe Effect Level (SEL) for mercury in freshwater, which is 2,000 ppb and describes a contamination level that causes “pronounced disturbance” for most freshwater benthic organisms (Buchman, M. F., 2008; NOAA, FAQs). The spatial extent of the contaminated sediment is unknown, but should the town of Durham determine that removal is the best option for Mill Pond Dam, sediment with high levels of mercury could resurface and mobilize downstream. This sediment could be hazardous to aquatic life as well as the people who fish and kayak on Oyster River. Uncovering such elevated levels of mercury in buried sediment at Mill Pond highlights the importance of understanding the quantity and quality of impounded sediment before dam removal occurs, so that steps can be taken to protect human and aquatic health.
Beyond using the data to characterize each impoundment and to determine the implications of a dam removal, I tried to find relationships and trends that could be applied to additional impoundments. However, despite my best efforts, the data did not reveal statistically strong relationships among characteristics such as grain-size distribution and mercury content. Working with real data collected from the field proved to be a challenge as I generated graph after graph and map after map questioning what conclusions could be made from the results of these analyses. Through this process, I gained a strong appreciation for statistics and data analysis, and I discovered the importance of having a large enough sample pool size that represents a wide spectrum of values.
Unforeseen Challenges
As I discovered, any research project comes with many unforeseen challenges. During the first two weeks of the program, when developing my laboratory methods and planning the exact location and number of field samples, almost every aspect of my plans was derailed to some degree.
I had planned to collect at least four cores at each of my research sites, but I quickly learned this was an unrealistic expectation because of limited time. When sampling my first core in the middle of the Sawyer Mill impoundment, I drove the corer so deep into the sediment that it got stuck. Dr. Lightbody and I had to row back to shore, and she had to retrieve a sledgehammer from her house to get the corer back out.
After sieving my first grab sample, I realized that the series of sieve sizes I had carefully selected based on previously conducted studies was entirely inappropriate for the fine-grained sediments I was working with. I had to spend a full day sieving and re-sieving samples to determine the optimal array of sieve sizes to yield a more even distribution of sediment on each sieve.
The oxygen tank was empty on my first mercury analysis run on the Direct Mercury Analyzer, and I had to redo the entire run the next day with a new oxygen tank. I encountered many more obstacles, from faulty equipment and poor weather to learning how to use completely foreign lab techniques or computer software. Preparation and foresight are vital components of a research project, but they will never account for all the uncertainties faced. Through these challenges, I gained confidence in making timely decisions and developing innovative solutions in the field and lab. I also discovered that encountering unexpected obstacles is the hallmark of research, and that the critical thinking required to move forward is ultimately what makes research so rewarding.
From REAP to the Future
Conducting this research provided an exciting glimpse into the career that lies ahead of me—one in which I can play the role of scientist, engineer, and researcher. REAP gave me the opportunity to engage in each facet of this project, whether trekking through a mudflat in a pair of oversized waders, preparing samples for analysis in a geochemistry lab, or sitting in front of a computer modeling the results of my research.
After my REAP experience, I was able to share the results of my analyses with UNH students and faculty, several Durham town residents, and the engineering company hired to conduct a dam removal feasibility report at Mill Pond. As a civil engineering student dedicated to the health and welfare of the public, knowing that my research has the potential to inform local communities concerning how to best preserve their environment makes the endless hours in the lab and in the field seem insignificant. Participating in REAP fostered my love for engineering and inspired future dreams of the research I will conduct in graduate school and beyond.
The research outlined in this report was made possible through the support of several UNH faculty and graduate students. Thank you to Joel Johnson, Ruth Varner, Scott Greenwood, and Tom Lippman for lending the sampling and lab equipment required to complete this research. Thank you to Julie Bryce and Flor Fahnestock for providing expertise on processing samples for mercury content, and for providing their geochemistry lab for sample analysis. Thank you to Alexandra Evans and Eliza Balch for their assistance and collaboration at the field sites. Thank you to Peyton Sanborn for her assistance in sample collection and her analysis of the E-trex 10 Garmin handheld GPS accuracy. Thank you to Marty McCrone for his help locating potential sources of mercury contamination in Mill Pond and his assistance in determining the appropriate disposal methods of sediment waste. Thank you to the Hamel Center for Undergraduate Research for providing the funding required to conduct this research. A special thank-you to Anne Lightbody for her knowledgeable guidance and consistent encouragement throughout this research process.
References
American Society of Civil Engineers (ASCE). (2017). Dams. 2017 Infrastructure Report Card, www.infrastructurereportcard.org/cat-item/dams/.
Basic Information about Mercury. (2019). United States Environmental Protection Agency. www.epa.gov/mercury/basic-information-about-mercury.
Bellmore, R. J., Duda, J. J., Craig, L. S., Greene, S. L., Torgersen, C. E., Collins, M. J., and Vittum, K. (2017). Status and trends of dam removal research in the United States. WIREs Water, 4: e1164. doi:10.1002/wat2.1164.
Buchman, M. F. (2008). NOAA Screening Quick Reference Tables, NOAA OR&R Report 08-1, Seattle, WA, Office of Response and Restoration Division, National Oceanic and Atmospheric Administration, 34 pages.
Edwardson, K., Milone & MacBroom, Inc. (2016). Guidance for assessing and managing sediment behind dams/barriers. New Hampshire Department of Environmental Services.
Evans, J. E. (2015). Contaminated sediment and dam removals: Problem or opportunity? Eos, 96. doi:10.1029/2015EO036385.
Lawson, M. (2016). Case studies on the fiscal, economic, social, and environmental benefits of dam removal. Headwaters Economics. Bozeman, MT.
Major A. R., and J. P. Warner. 2008. Contaminant sampling to facilitate dam removals/habitat restoration in New England. USFWS Special Report FY08-NEFO-1-EC. New England Field Office, Concord, NH. 53 pp.
NOAA Office of Response and Restoration. Frequently Asked Questions (FAQs) about SQuiRTS. https://response.restoration.noaa.gov/environmental-restoration/environm...
Total organic carbon (TOC/Foc) in soil/sediment by combustion (PBM). (2014). Government of British Columbia. https://www2.gov.bc.ca/assets/gov/environment/research-monitoring-and-re....
Author and Mentor Bios
Hannah Miller, from Nottingham, New Hampshire, is a civil engineering major in the Honors Program at the University of New Hampshire (UNH). During her first year, Hannah built river stage monitoring sensors with research mentor Dr. Anne Lightbody through the Innovation Scholars program. Dr. Lightbody encouraged her to apply for a Research Experience and Apprenticeship Program (REAP) fellowship to study dam removal the following summer. Through REAP, Hannah saw the material she learned in the classroom come to life, and she became intrigued by the interaction between civil engineers and the public. Her REAP project allowed her to develop field skills, taught her how to analyze data and generate models, and, most important, deepened her passion for civil engineering. After graduation, Hannah aims to pursue a UNH master’s program in environmental or water resource engineering and then work as a civil/environmental engineer at a private engineering firm in New Hampshire. Eventually, her goal is to pursue a PhD in civil engineering and become a professor.
Anne Lightbody is an associate professor and graduate program coordinator in the Department of Earth Sciences at the University of New Hampshire (UNH). Her research focuses on flow and transport within surface water systems, including rivers, streams, lakes, freshwater wetlands, and saltwater marshes. She is particularly interested in coupling improved understanding of small-scale physical processes to larger scale modeling and prediction. This work is fundamental yet also has clear applications, reaching into real-world management issues including stream restoration, constructed treatment wetland design, aquaculture, and suspended sediment pollution control. Dr. Lightbody encouraged Hannah to apply for a Research Experience and Apprenticeship Program (REAP) grant and served as her research mentor during the summer of 2019.
Copyright 2020, Hannah Miller