Approximately 171,000 cases of child physical abuse were substantiated in 2003.
- Physical abuse constituted 19% of all child maltreatment substantiations for 2003.
* CCRC Projections based on estimates from U.S. Department of Health & Human Services, Children's Bureau. 1990 through 2005. Child Maltreatment (1990-2003): Reports From the States to the National Child Abuse and Neglect Data System. Washington, D.C.: Government Printing Office.
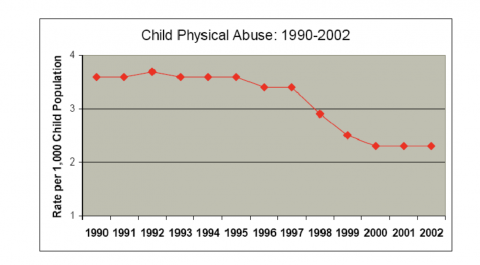
- Child physical abuse substantiations have declined noticeably since the mid 1990's.
- There has been a 36% decline in the rate per 1,000 of substantiated cases of child physical abuse since 1992.
- There has been a 29% decline in the estimated number of child physical abuse substantiations since 1992.
|
Year |
Estimated Number of Children |
Rate per 1,000 children |
|
1990 |
228,000 |
3.6 |
|
1991 |
235,000 |
3.6 |
|
1992 |
241,000 |
3.7 |
|
1993 |
241,000 |
3.6 |
|
1994 |
242,000 |
3.6 |
|
1995 |
244,000 |
3.6 |
|
1996 |
238,000 |
3.4 |
|
1997 |
235,000 |
3.4 |
|
1998 |
204,000 |
2.9 |
|
1999 |
173,000 |
2.5 |
|
2000 |
170,000 |
2.3 |
|
2001 |
168,000 |
2.3 |
|
2001 |
168,000 |
2.3 |
|
2002 |
167,000 |
2.3 |
|
2003 |
171,000 |
2.3 |

Graph of Child Physical Abuse in the United States: 1990-2003
CCRC projections based on estimates from, U.S. Department of Health and Human Services, Children’s Bureau. 1990 through 2002. Child Maltreatment (1990 - 2002): Reports from the States to the National Child Abuse and Neglect Data System. Washington, DC: Government Printing Office.
