


April 11, 2024
Search the UNH Newsroom


UNH in the News
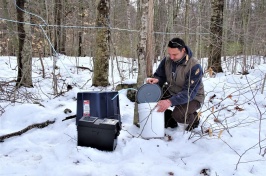
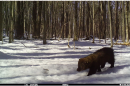
- What Happened to All the Snow? Snowpack decline in northeastern forests may intensify climate changeMarch 20th, 2023Outlet: Sierra Magazine
- Sibling aggression and abuse go beyond rivalry – bullying within a family can have lifelong repercussionsMarch 20th, 2023Outlet: The Conversation
- PODCAST: UNH's President Gives Stanford Law an 'F-Minus' on Free SpeechMarch 20th, 2023Outlet: NH Journal
University of New Hampshire President James Dean joins NHJournal to talk about the status of free speech on campus in the... - NATIONAL PERSPECTIVEMarch 17th, 2023Outlet: Williston Herald Online
...and where, in this month's Granite State Poll conducted by the University of New Hampshire Survey Center,... - CDC news release magnified spike in sexual violence against girlsMarch 14th, 2023Outlet: SFGate
...in the YRBS were flat or showed declines," said David Finkelhor, a University of New Hampshire professor who is...